Chapter 3.1 – Common ML Algorithms (Intuition Only)
Understanding common ML algorithms through intuition and automation analogies, no heavy math.
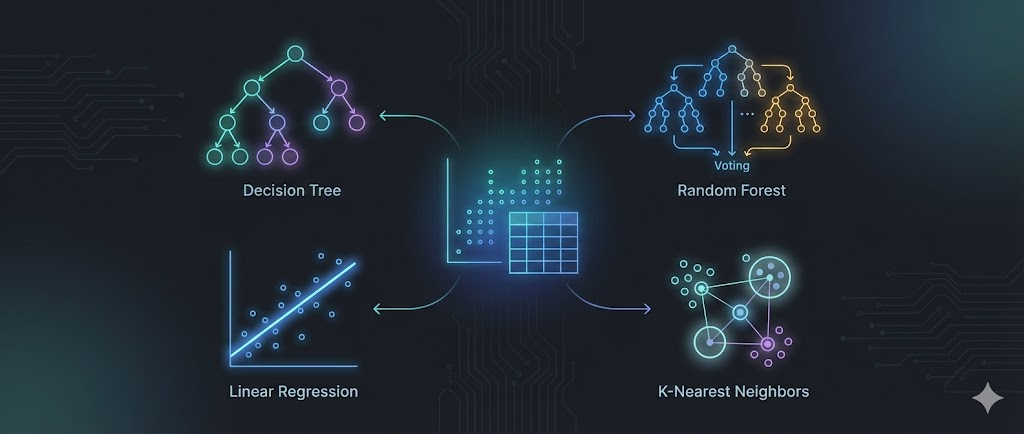
Understanding the Tools in the Toolbox
How I Started Thinking About Algorithms
When I was learning automation, I didn’t ask: “Which tool is most advanced?”
I asked: “What tool fits this problem best?”
- Terraform → Infra state
- Ansible → Config orchestration
- Bash → Quick glue work
ML algorithms turned out to be the same. Each one is good at certain shapes of problems — and bad at others.
Key insight: There is no “best” algorithm. There’s only best fit for this situation.
That mindset saved me a lot of wasted time.
1. Linear Regression — The Straight-Line Estimator
When I’d Reach for It
When I need to predict a number and the relationship feels roughly linear.
Example:
- “How long will this deployment take?”
- “What will this infrastructure cost?”
Mental Model
Linear regression draws the best straight line through your data and uses it to predict future values.
Automation analogy: Estimating deployment time from number of resources — more resources → more time, roughly in a straight line.
xychart-beta
    title "Linear Regression: Deployment Time vs Resources"
    x-axis "Number of Resources" [0, 10, 20, 30, 40, 50]
    y-axis "Deployment Time (minutes)" 0 --> 30
    line [0, 5, 10, 15, 20, 25]
Where It Works Well
- Capacity planning
- Cost estimation
- Simple forecasting
- Any situation where changes are smooth and proportional
Example
- Predicting deployment time
- Input: Number of resources being deployed
- Output: Expected deployment duration
- Data points:
- 10 resources → 5 minutes
- 20 resources → 10 minutes
- 30 resources → 15 minutes
Takeaway equation: deployment_time = 0.5 × resources
Where It Breaks
- Categories (high/medium/low risk)
- Sudden jumps or thresholds
- Complex interactions
Example failure:
- Predicting incident severity
- Input: Number of failed services
- Output: Severity (P1/P2/P3)
- Problem: Severity doesn’t increase linearly
- 1 failed service → P3
- 2 failed services → P3
- 3 failed services → P1 (sudden jump)
- Linear regression would give weird answers like “P2.7”
Warning: Linear regression doesn’t understand categories or sharp transitions.
Key Takeaway
Use linear regression when:
- Output is numeric
- Relationship is roughly straight-line
- You want something fast, simple, and explainable
Avoid it when:
- You’re predicting labels or risk levels
- The world behaves in steps, not slopes
Real-world use: Cost estimation, sales forecasting, capacity planning
2. Decision Trees — The If/Then Flowchart
When I’d Reach for It
When I want explainable decisions and my problem feels like rules:
- “If this… then that…”
Mental Model
A decision tree is literally a flowchart: Each node asks a question, each branch narrows the path, until you reach a decision.
1
2
3
4
5
6
7
8
9
10
if peak_hours:
    if environment == 'prod':
        if resources > 10:
            risk = 'HIGH'
        else:
            risk = 'MEDIUM'
    else:
        risk = 'LOW'
else:
    risk = 'LOW'
Automation analogy: Approval workflows — each decision gate leads to another question.
Visual Example
%%{init: {"theme": "base"} }%%
flowchart TD
linkStyle default stroke:#888,stroke-width:2px;
    Start([Deployment Request])
    Q1{Peak Hours?}
    Q2{Environment<br/>= Prod?}
    Q3{Resources<br/>> 10?}
    Q4{Automated<br/>Tests Pass?}
    R1[Risk: LOW]
    R2[Risk: MEDIUM]
    R3[Risk: HIGH]
    Start --> Q1
    Q1 -->|Yes| Q2
    Q1 -->|No| R1
    Q2 -->|Yes| Q3
    Q2 -->|No| R2
    Q3 -->|Yes| R3
    Q3 -->|No| Q4
    Q4 -->|Yes| R2

    Q4 -->|No| R3

    classDef start fill:#e3f2fd,stroke:#1976d2,stroke-width:3px;
    classDef question fill:#fffde7,stroke:#fbc02d,stroke-width:2px;
    classDef risklow fill:#e8f5e9,stroke:#388e3c,stroke-width:2px;
    classDef riskmed fill:#fffde7,stroke:#fbc02d,stroke-width:2px;
    classDef riskhigh fill:#ffebee,stroke:#d32f2f,stroke-width:2px;
    class Start start;
    class Q1,Q2,Q3,Q4 question;
    class R1 risklow;
    class R2 riskmed;
    class R3 riskhigh;
Where It Works Well
- Mixed data (numbers + categories)
- Explainable decisions
- Finding interactions (prod + peak hours + big deploy = high risk)
Where It Breaks
- Overfits easily (memorizes training data)
- Small data changes can produce totally different trees
Warning: Deep trees look accurate in training but fail badly in production.
Key Takeaway
Use Decision Trees when:
- You need explainability
- Logic naturally feels rule-based
- You want something visual and debuggable
Avoid them when:
- Accuracy matters more than interpretability
- Data is noisy and complex
Real-world use: Credit approval, troubleshooting guides, medical diagnosis
3. Random Forest — The Wisdom of Crowds
When I’d Reach for It
When I want strong accuracy on messy real-world data and can sacrifice some explainability.
Mental Model
If one decision tree can overfit or be unstable, what if we create many trees and let them vote?
Random Forest trains many decision trees on different slices of the data and lets them vote.
Automation analogy: Multiple engineers reviewing a deployment — final decision by majority.
Visual Example
%%{init: {"theme": "base"} }%%
flowchart TD
linkStyle default stroke:#888,stroke-width:2px;
    Data[Training Data]
    S1[Random Sample 1]
    S2[Random Sample 2]
    S3[Random Sample 3]
    T1[Tree 1<br/>HIGH]
    T2[Tree 2<br/>MEDIUM]
    T3[Tree 3<br/>HIGH]
    Vote[Majority Vote]
    Final[Final Prediction: HIGH]
    Data --> S1 --> T1 --> Vote
    Data --> S2 --> T2 --> Vote
    Data --> S3 --> T3 --> Vote
    Vote --> Final

    classDef data fill:#e3f2fd,stroke:#1976d2,stroke-width:3px;
    classDef sample fill:#fffde7,stroke:#fbc02d,stroke-width:2px;
    classDef tree fill:#e8f5e9,stroke:#388e3c,stroke-width:2px;
    classDef vote fill:#ffe0b2,stroke:#f57c00,stroke-width:2px;
    classDef final fill:#c8e6c9,stroke:#2e7d32,stroke-width:3px;
    class Data data;
    class S1,S2,S3 sample;
    class T1,T2,T3 tree;
    class Vote vote;
    class Final final;
Where It Works Well
- Complex interactions
- Noisy, messy real-world data
- Mixed numeric + categorical features
- Most production ML problems
Where It Breaks
- Hard to explain individual decisions
- Slower than single models
- Harder to debug
Warning: Don’t use Random Forest when transparency or real-time latency is critical.
Key Takeaway
Use Random Forest when:
- You want accuracy
- Data is messy
- You don’t need strict explainability
Avoid it when:
- You must justify every decision
- Latency or simplicity is critical
Real-world use: Fraud detection, customer churn prediction, risk assessment
4. Support Vector Machines (SVM) — Drawing the Best Boundary
When I’d Reach for It
When categories are cleanly separable and the dataset isn’t massive.
Mental Model
SVM finds the best possible boundary that separates categories with the widest margin.
Automation analogy: Drawing the strictest access-control rule that separates “allowed” from “blocked” with the biggest safety buffer.
Visual Example
quadrantChart
    title SVM Decision Boundary
    x-axis Low Resource Count --> High Resource Count
    y-axis Short Duration --> Long Duration
    Success: [0.25, 0.25]
    Success: [0.3, 0.3]
    Failure: [0.75, 0.75]
    Failure: [0.8, 0.7]
Where It Works Well
- Clear boundaries
- Small-to-medium datasets
- High-dimensional feature spaces
Where It Breaks
- Very large datasets (slow)
- Overlapping categories
- Hard to interpret
Warning: If your data clusters overlap heavily, SVM struggles.
Key Takeaway
Use SVM when:
- Classes are cleanly separable
- Dataset isn’t huge
- You want strong performance on structured data
Avoid it when:
- Data is noisy or overlapping
- Explainability matters
Real-world use: Text classification, image recognition (though deep learning is now more common)
5. K-Nearest Neighbors (KNN) — You Are Your Neighbors
When I’d Reach for It
When datasets are small, and similarity naturally makes sense.
Mental Model
To predict something, KNN finds the K most similar past examples and lets them vote.
Automation analogy: Predicting deployment risk by looking at the 5 most similar past deployments and copying their outcome.
Visual Example
%%{init: {"theme": "base"} }%%
flowchart TD
    New(["New Deployment\nProd, 12 resources, peak"]):::new
    N1(["Neighbor 1\nProd, 10 res, peak\nFAILED ✗"]):::fail
    N2(["Neighbor 2\nProd, 15 res, peak\nFAILED ✗"]):::fail
    N3(["Neighbor 3\nProd, 11 res, peak\nFAILED ✗"]):::fail
    N4(["Neighbor 4\nProd, 13 res, off-hours\nSUCCESS ✓"]):::success
    N5(["Neighbor 5\nProd, 9 res, peak\nFAILED ✗"]):::fail
    Vote(["Vote Count:\n4 Failed, 1 Success"]):::vote
    Pred(["Prediction:\nHIGH RISK"]):::pred
    New -.-> N1
    New -.-> N2
    New -.-> N3
    New -.-> N4
    New -.-> N5
    N1 --> Vote
    N2 --> Vote
    N3 --> Vote
    N4 --> Vote
    N5 --> Vote
    Vote --> Pred
    classDef new fill:#e3f2fd,stroke:#1976d2,stroke-width:3px;
    classDef fail fill:#ffebee,stroke:#d32f2f,stroke-width:2px;
    classDef success fill:#e8f5e9,stroke:#388e3c,stroke-width:2px;
    classDef vote fill:#fffde7,stroke:#fbc02d,stroke-width:2px;
    classDef pred fill:#ffebee,stroke:#d32f2f,stroke-width:3px;
linkStyle default stroke:#888,stroke-width:2px;
Where It Works Well
- Very small datasets
- Simple similarity-based problems
- Quick prototyping
Where It Breaks
- Large datasets (slow predictions)
- High-dimensional data
- Features on different scales
Warning: KNN falls apart fast as data grows.
Key Takeaway
Use KNN when:
- Your dataset is small
- Similarity between examples is meaningful
- You want a simple, intuitive approach
Avoid it when:
- The dataset is large (slow predictions)
- There are many features (high-dimensional data)
- Features are on very different scales
Real-world use: Recommender systems, anomaly detection, handwriting recognition
6. How I Actually Choose Algorithms (In Practice)
Instead of memorizing algorithms, I ask:
- Do I need to explain decisions?
- Is the output numeric or categorical?
- Is the dataset small or large?
- Is accuracy or interpretability more important?
Decision Flow
%%{init: {"theme": "base"} }%%
flowchart TD
linkStyle default stroke:#888,stroke-width:2px;
    Start([Choose Algorithm])
    Q1{Need explainability?}
    Q2{Output numeric?}
    Q3{Dataset large?}
    A1[Decision Tree]
    A2[Linear Regression]
    A3[Random Forest]
    A4[KNN]
    Start --> Q1
    Q1 -->|Yes| A1
    Q1 -->|No| Q3
    Q3 -->|Large| A3
    Q3 -->|Small| A4
    Q2 -->|Yes| A2
    classDef start fill:#e3f2fd,stroke:#1976d2,stroke-width:3px;
    classDef question fill:#fffde7,stroke:#fbc02d,stroke-width:2px;
    classDef tree fill:#e8f5e9,stroke:#388e3c,stroke-width:2px;
    classDef linear fill:#f3e5f5,stroke:#7e57c2,stroke-width:2px;
    classDef forest fill:#c8e6c9,stroke:#2e7d32,stroke-width:2px;
    classDef knn fill:#ffe0b2,stroke:#f57c00,stroke-width:2px;
    class Start start;
    class Q1,Q2,Q3 question;
    class A1 tree;
    class A2 linear;
    class A3 forest;
    class A4 knn;
Quick Decision Table
| Algorithm | Use When | Avoid When |
|---|---|---|
| Linear Regression | Numeric prediction, linear trends | Categories, complex patterns |
| Decision Tree | Explainable rule-based logic | High accuracy required |
| Random Forest | Accuracy on messy real-world data | Need transparency or speed |
| SVM | Clear category separation, small data | Large or overlapping datasets |
| KNN | Tiny datasets, similarity-based probs | Large or high-dimensional data |
7. My Deployment Risk Example — What I’d Actually Use
Problem: Predict deployment risk (High / Medium / Low)
Data: ~10,000 deployments
Features: Env, size, time, change type
My choice: Random Forest
- Handles mixed data
- Learns complex interactions
- Strong accuracy in messy production data
- Feature importance gives partial explainability
Backup choice: Decision Tree
- If auditability is mandatory
- Trade-off: Lower accuracy
Not Linear Regression
- Can’t predict categories
- Too simple for interactions
8. What I Wish I Knew Earlier
Practitioner’s Lessons:
- Chasing the “best” algorithm wasted time; matching the tool to the problem made all the difference.
- Most real progress came from improving data quality and features, not switching models.
- Simple models (like Decision Trees or Linear Regression) solved more problems than expected—don’t overlook them.
- Ensemble methods (like Random Forest) often win in production, but can be harder to explain.
- It’s better to deeply understand a few algorithms than to superficially know many.
- Always start simple, validate, and only add complexity when needed.
What’s Next?
➡ Chapter 3.2 – Overfitting & Underfitting
Next we’ll cover:
- Why models fail in production
- Bias vs variance
- How to detect and fix overfitting
- Validation strategies that actually work
Architectural Question: What steps can you take to ensure your chosen algorithm works reliably in production, and what are the most common pitfalls to avoid?
We now know which tools to pick — next we’ll learn how to make sure they don’t lie to us.