Chapter 1.3 – Types of Machine Learning
Picking the Right Tool for Your Data
Why ML Types Matter (in Practice)
After understanding how machines learn from examples, the next question hit me: which type of ML would I actually use for different problems?
When I first saw terms like supervised, unsupervised, and reinforcement learning, I thought they were just academic categories. But Then I started thinking about my deployment risk assessment example from earlier chapters.
- Do I have labeled data? (e.g., deployments marked as Success/Failure)
- Or just raw logs? (no labels, just patterns)
That question changes everything. The ML type isn’t about what’s cool—it’s about what your data allows.
It’s like automation tools:
Terraformfor infrastructure? Makes sense.Terraformto restart a service? Technically possible, but the wrong tool.
Same with ML types—pick based on your data and problem, not what sounds interesting.
Key Takeaway: The type of machine learning you use depends on your data, not personal preference.
1. The Main Types (and Why They Confused Me)
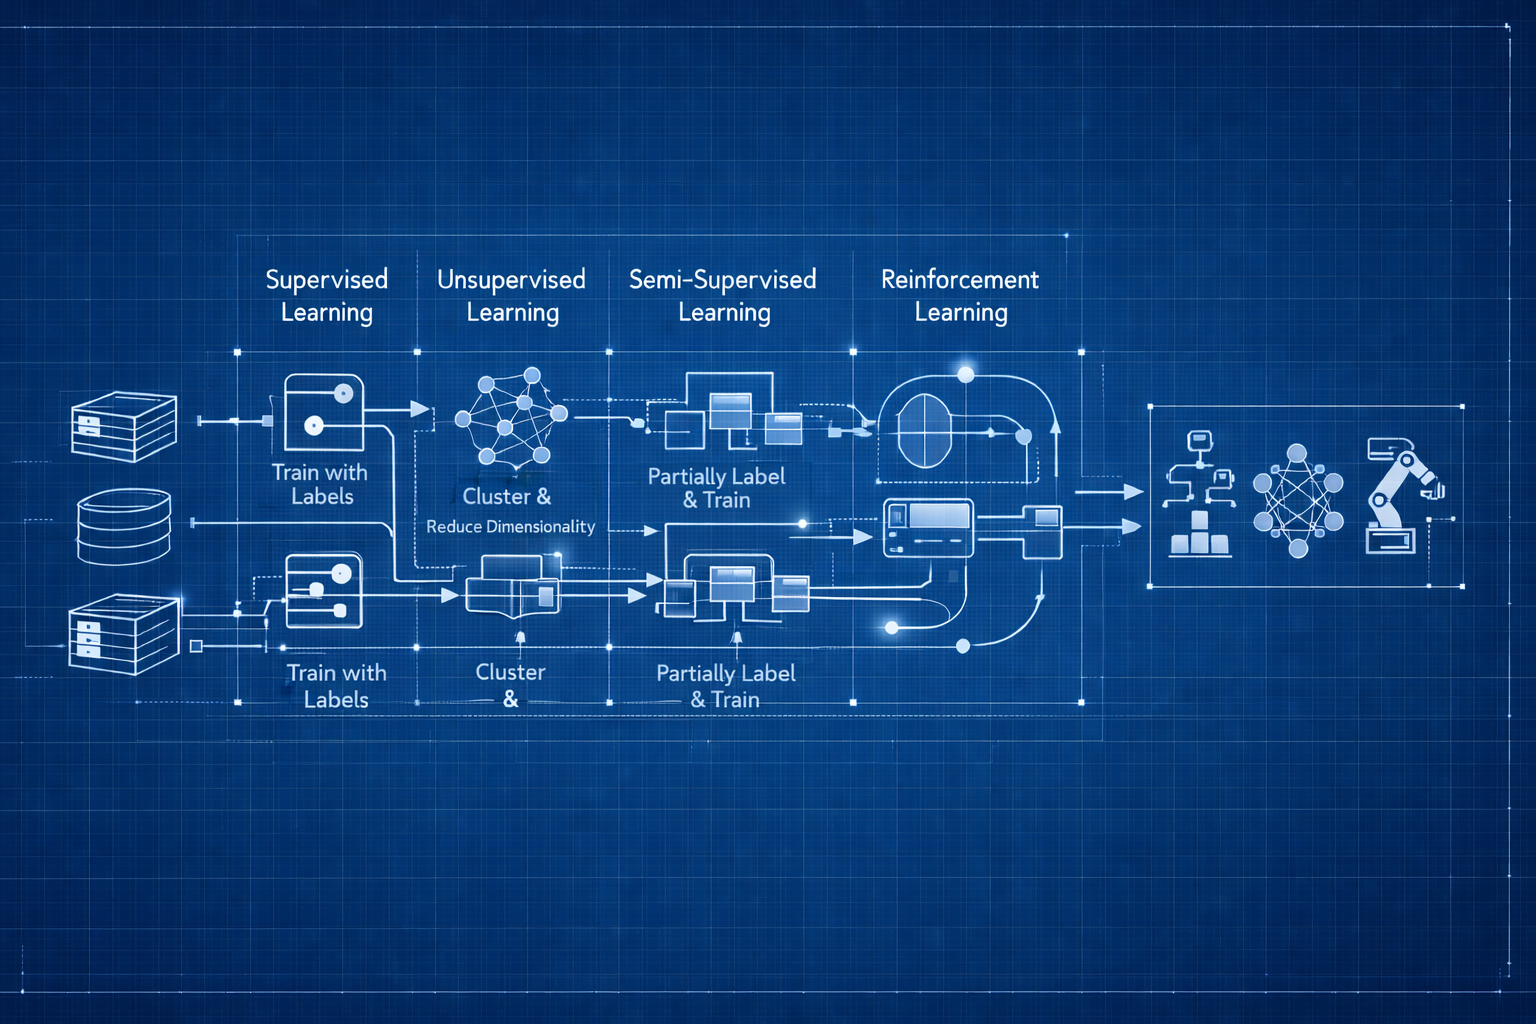
When I started, I thought ML was just “ML.” But there are fundamentally different approaches, based on how they learn:
- Supervised Learning: You provide labeled examples (input + correct output)
- Unsupervised Learning: System finds patterns in unlabeled data
- Semi-Supervised Learning: Combines a small labeled set with a large unlabeled set
- Reinforcement Learning: System learns through trial, error, and rewards
Let’s break down what each one means in practice, with real engineering analogies and key takeaways.
Supervised Learning: When You Know the Right Answers
How I Understood It
This was the easiest type for me to grasp—it’s like Terraform or Ansible:
- You define the desired state (what you want)
- System compares current vs desired
- Takes action to match
Supervised Learning is similar:
- You provide labeled examples (inputs with correct answers)
- Model learns the pattern
- Applies that pattern to new data
If you have historical data with known outcomes, supervised learning is your starting point.
Key Takeaway: Supervised learning is ideal when you have historical data with known outcomes.
How It Works
Training Phase:
1
2
- Input: Email text → Label: "Spam" or "Not Spam"
- Input: Server metrics → Label: "Normal" or "Failing"
Prediction Phase:
1
2
- New email → Model predicts: "Spam" or "Not Spam"
- New metrics → Model predicts: "Normal" or "Failing"
Conceptual workflow:
flowchart LR
    subgraph training["Training Phase"]
        direction TB
        T1[Historical Deployments<br/>with Labels] --> T2[Extract Features]
        T2 --> T3[Train Model]
        T3 --> T4[Learned Model]

        style T1 fill:#e3f2fd,stroke:#1976d2,stroke-width:2px
        style T2 fill:#fff3e0,stroke:#f57c00,stroke-width:2px
        style T3 fill:#f3e5f5,stroke:#7b1fa2,stroke-width:2px
        style T4 fill:#e8f5e9,stroke:#388e3c,stroke-width:2px
    end

    subgraph prediction["Prediction Phase"]
        direction TB
        P1[New Deployment<br/>Request] --> P2[Extract Features]
        P2 --> P3[Apply Model]
        P3 --> P4[Risk Prediction<br/>Low/Medium/High]

        style P1 fill:#e3f2fd,stroke:#1976d2,stroke-width:2px
        style P2 fill:#fff3e0,stroke:#f57c00,stroke-width:2px
        style P3 fill:#f3e5f5,stroke:#7b1fa2,stroke-width:2px
        style P4 fill:#e8f5e9,stroke:#388e3c,stroke-width:2px
    end

    T4 -.->|Model is used| P3

    style training fill:#fafafa,stroke:#666,stroke-width:2px,stroke-dasharray: 5 5
    style prediction fill:#fafafa,stroke:#666,stroke-width:2px,stroke-dasharray: 5 5
Common Supervised Learning Tasks
- Classification: Predict a category or class
Examples: Spam/not spam, incident severity (P1/P2/P3), normal/anomaly - Regression: Predict a numeric value
Examples: Cost prediction, resource usage forecasting, time-to-failure estimation
Real Use Cases
Our Running Example: Deployment Risk Assessment
Supervised learning in action:
- Training data: Historical deployments labeled by outcome (Success/Failure/Incident)
- Features: Change type, resource count, deployment time, files modified, environment
- Labels: Risk category (Low/Medium/High) or Success/Failure
- Prediction: New deployment request → Model predicts risk level
1
2
3
4
5
6
Training Phase:
Deployment A: {infra, prod, 10 resources, peak hours} → High Risk (Failed)
Deployment B: {config, dev, 2 resources, off-hours} → Low Risk (Success)

Prediction Phase:
New deployment: {infra, prod, 8 resources, peak hours} → Predicted: High Risk (85% confidence)
Other examples:
- Email spam filtering (text → spam/not spam)
- Incident classification (metrics → P1/P2/P3 severity)
When to Use It
Use supervised learning when:
- You have labeled historical data
- You know the correct answers for past examples
- You want to predict specific outcomes
Automation Analogy: Like defining infrastructure as code—you know the desired end state.
Recap: Supervised learning = labeled data, clear outcomes, and direct predictions. Start here if you have the data!
Unsupervised Learning: When You Don’t Have Labels
What Clicked for Me
At first, I thought: “Why use unsupervised learning? It doesn’t even predict things.”
But then I remembered log analysis tools that cluster errors automatically:
- You don’t tell them what error types exist
- They discover patterns and group similar logs
- They reveal issues you didn’t know to look for
That’s when it clicked: Sometimes the most valuable insights come from patterns you didn’t know existed.
If I’m exploring deployment data and don’t know what “risky patterns” look like, unsupervised learning can help me discover them.
Key Takeaway: Use unsupervised learning to discover patterns you didn’t know existed in your data.
How It Works
- Input: Unlabeled data (no correct answers provided)
- Process: Model finds patterns, groups, or anomalies
- Output: Discovered structure or insights
Conceptual workflow:
flowchart TB
    U1[Unlabeled Deployment<br/>History] --> U2[Feed to Model]
    U2 --> U3{Pattern Discovery}
    U3 --> U4[Cluster 1:<br/>Late-night configs]
    U3 --> U5[Cluster 2:<br/>Peak-hour infra]
    U3 --> U6[Cluster 3:<br/>Weekend hotfixes]
    U3 --> U7[Anomalies:<br/>Unusual patterns]

    style U1 fill:#e3f2fd,stroke:#1976d2,stroke-width:2px
    style U2 fill:#fff3e0,stroke:#f57c00,stroke-width:2px
    style U3 fill:#f3e5f5,stroke:#7b1fa2,stroke-width:2px
    style U4 fill:#e8f5e9,stroke:#388e3c,stroke-width:2px
    style U5 fill:#e8f5e9,stroke:#388e3c,stroke-width:2px
    style U6 fill:#e8f5e9,stroke:#388e3c,stroke-width:2px
    style U7 fill:#ffebee,stroke:#d32f2f,stroke-width:2px
Common Unsupervised Learning Tasks
- Clustering: Group similar data points together
Examples: User segmentation, log event grouping, resource usage patterns - Anomaly Detection: Find unusual or rare data points
Examples: Detecting system failures, security threats, unusual traffic patterns - Visualization/Dimensionality Reduction: Simplify complex data for visualization or processing
Examples: Reducing hundreds of metrics to key indicators, visualizing high-dimensional data - Association Rule Learning: Discover relationships between data
Examples: “Users who deploy microservices also use Kubernetes,” resource co-occurrence patterns
Real Use Cases
Our Running Example: Deployment Risk Assessment
Unsupervised learning in action:
- Clustering: Group deployments by natural patterns (not pre-labeled)
- Discovers: “Late-night config changes,” “Peak-hour infrastructure updates,” “Weekend hotfixes”
- Use: Identify risky deployment patterns you didn’t know existed
- Anomaly detection: Feed normal deployment behavior (unlabeled)
- Model learns what “normal” looks like
- Flags: Unusual deployments that don’t match any known pattern
- Example: Deployment with resource count 10x higher than typical
Other examples:
- Log clustering (group similar error patterns without pre-defining categories)
- User behavior segmentation (discover “power users” vs “occasional users”)
When to Use It
Use unsupervised learning when:
- You don’t have labeled data
- You want to discover hidden patterns
- You’re exploring data for insights
Automation Analogy: Like monitoring tools that auto-discover patterns vs. ones where you predefine all alerts.
Recap: Unsupervised learning = no labels, pattern discovery, and new insights. Use it to explore the unknown in your data.
Semi-Supervised Learning: The Practical Compromise
The Scenario That Made This Click
Imagine you have 50,000 deployment records to classify:
- Option 1: Label all 50,000 manually → Weeks of work
- Option 2: Use unsupervised → No specific risk predictions
- Option 3: Semi-supervised → Label 100, let ML learn from all 50,000
Semi-supervised suddenly made perfect sense. It’s like infrastructure discovery tools:
- You label a few key resources manually
- System learns from your labels
- Auto-labels the rest based on patterns
- You correct mistakes as needed
Translation: Get supervised learning predictions without the labeling nightmare.
Key Takeaway: Semi-supervised learning lets you leverage a small labeled set and a large unlabeled set for practical accuracy.
How It Works
- Input: Small amount of labeled data + Large amount of unlabeled data
- Process: Model learns from labeled examples, applies to unlabeled data
- Output: Predictions leveraging both labeled patterns and unlabeled volume
Conceptual workflow:
flowchart TB
    subgraph input["Input Data"]
        S1[100 Labeled<br/>Deployments]
        S2[50,000 Unlabeled<br/>Deployments]
    end

    S1 --> S3[Train Initial Model<br/>from Labels]
    S2 --> S4[Learn Patterns<br/>from Volume]
    S3 --> S5[Combined Model]
    S4 --> S5
    S5 --> S6[Accurate Predictions<br/>with Minimal Labeling]

    style S1 fill:#e8f5e9,stroke:#388e3c,stroke-width:2px
    style S2 fill:#e3f2fd,stroke:#1976d2,stroke-width:2px
    style S3 fill:#fff3e0,stroke:#f57c00,stroke-width:2px
    style S4 fill:#fff3e0,stroke:#f57c00,stroke-width:2px
    style S5 fill:#f3e5f5,stroke:#7b1fa2,stroke-width:2px
    style S6 fill:#e8f5e9,stroke:#388e3c,stroke-width:2px
    style input fill:#fafafa,stroke:#666,stroke-width:2px,stroke-dasharray: 5 5
Why It Matters
Labeling data is expensive and time-consuming:
- Manually classifying thousands of incidents? Weeks of work.
- Labeling 100 examples? A few hours.
Semi-supervised learning lets you:
- Label a small subset manually
- Train on millions of unlabeled examples
- Get accuracy close to fully supervised approaches
Real Use Cases
Our Running Example: Deployment Risk Assessment
Semi-supervised learning in action:
- Small labeled set: Manually review and label 100 critical deployments (High/Medium/Low risk)
- Large unlabeled set: 50,000+ historical deployment records (unlabeled)
- Model learns from both: Patterns from labeled examples + volume from unlabeled data
- Result: Accurate risk predictions without labeling 50,000 deployments manually
1
2
3
Labeled: 100 deployments (manual review)
Unlabeled: 50,000 deployments (raw data)
→ Model achieves 85% accuracy vs 90% if all 50,100 were labeled
Savings: Weeks of manual labeling → Few hours
Other examples:
- Incident categorization (label 50 incidents, learn from 10,000)
- Security threat detection (label known attacks, learn from massive traffic volume)
When to Use It
Use semi-supervised learning when:
- Labeling all data is too expensive or slow
- You have some labeled examples
- You have lots of unlabeled data available
Automation Analogy: Like tagging resources—manually tag a few, auto-tag the rest based on patterns.
Recap: Semi-supervised learning = a little labeling, a lot of leverage. Use it when you want accuracy without the manual grind.
Reinforcement Learning: Still Wrapping My Head Around This
Why This One Is Different
Full transparency: This is the one I understand least. It’s more complex and the use cases feel more specialized.
Warning: Reinforcement learning is complex and best suited for dynamic optimization problems with clear feedback.
The concept makes sense when I think of auto-scaling:
- System tries scaling up/down
- Observes impact (latency, costs)
- Learns optimal strategy over time
Reinforcement learning works through trial, error, and feedback—the system experiments to find what works.
My understanding so far: This is for dynamic optimization problems where the system can safely experiment. Not where I’d start learning.
How It Works
- Agent takes action in environment
- Receives reward (positive) or penalty (negative)
- Learns which actions lead to better outcomes
- Adjusts strategy over time
Conceptual workflow:
flowchart LR
    R1[Deployment<br/>Scheduler<br/>Agent] -->|Try Action| R2{Deploy at<br/>Peak Hours?}
    R2 -->|Yes| R3[Environment<br/>Feedback]
    R2 -->|No| R3
    R3 -->|Success: +10<br/>Failure: -50<br/>Incident: -100| R4[Update Strategy]
    R4 -.->|Learn & Improve| R1

    R5[Week 1:<br/>40% success] -.->|Iterations| R6[Week 50:<br/>92% success]

    style R1 fill:#e3f2fd,stroke:#1976d2,stroke-width:2px
    style R2 fill:#fff3e0,stroke:#f57c00,stroke-width:2px
    style R3 fill:#f3e5f5,stroke:#7b1fa2,stroke-width:2px
    style R4 fill:#e8f5e9,stroke:#388e3c,stroke-width:2px
    style R5 fill:#ffebee,stroke:#d32f2f,stroke-width:2px
    style R6 fill:#e8f5e9,stroke:#388e3c,stroke-width:2px
Real Use Cases
Our Running Example: Deployment Risk Assessment
Reinforcement learning in action:
- Agent: Automated deployment scheduler
- Actions: Choose deployment time, approval routing, resource allocation strategy
- Feedback (Reward/Penalty):
- Success → +10 points
- Failure → -50 points
- Rollback → -30 points
- Peak hours incident → -100 points
- Learning: Over thousands of deployments, system learns optimal strategies
- When to auto-approve vs require review
- Best deployment windows for different change types
- Resource allocation patterns that minimize failures
1
2
3
Week 1: Random decisions → 40% success rate
Week 10: Learned patterns → 75% success rate
Week 50: Optimized strategy → 92% success rate
Other examples:
- Auto-scaling optimization (try strategies, measure cost+performance)
- Traffic routing (experiment with routes, minimize latency)
When to Use It
Use reinforcement learning when:
- Decisions happen sequentially over time
- There’s clear feedback (reward/penalty)
- The system can learn from experimentation
Automation Analogy: Like chaos engineering—system learns resilience through controlled failure.
Recap: Reinforcement learning = learning by doing, with feedback. Use it for dynamic optimization, but start simple!
2. Comparison: Supervised vs Unsupervised vs Semi-Supervised vs Reinforcement
| Aspect | Supervised | Unsupervised | Semi-Supervised | Reinforcement |
|---|---|---|---|---|
| Training Data | All labeled | All unlabeled | Small labeled + Large unlabeled | Environment feedback |
| Goal | Predict specific output | Discover patterns | Predict with limited labels | Maximize reward |
| Deployment Example | Predict risk from labeled history | Cluster deployment patterns | Label 100, learn from 50k | Learn optimal deployment strategy |
| Automation Analogy | IaC (known state) | Discovery tools | Auto-tagging resources | Self-tuning systems |
Quick Recap:
- Supervised: Labeled data, direct predictions
- Unsupervised: No labels, pattern discovery
- Semi-supervised: A little labeling, a lot of leverage
- Reinforcement: Learning by doing, with feedback
3. Other Ways to Categorize ML
Beyond supervision type, ML systems are also categorized by:
Online vs Batch Learning
- Batch Learning:
- Train on full dataset at once
- Model is fixed until next retraining
- Like rebuilding infrastructure from scratch
- Online Learning:
- Learns incrementally as new data arrives
- Model updates continuously
- Like applying incremental updates to infrastructure
Instance-Based vs Model-Based
- Instance-Based:
- Compares new data to stored examples
- No real “model” built
- Like pattern matching in logs
- Model-Based:
- Builds a generalized model from training data
- Applies model to new data
- Like creating predictive rules
4. How I Think About Choosing Now
Best Practice: Match your ML approach to the data and problem at hand—start simple, validate, and only add complexity when needed.
For deployment risk assessment, here’s how I’d approach the decision:
- Supervised Learning:
- I have historical deployments with known outcomes (Success/Failure)
- Goal: Predict if a new deployment will be risky
- Requirement: Need labeled historical data
- Unsupervised Learning:
- I’m exploring: What deployment patterns exist that I haven’t noticed?
- Goal: Discover hidden risk factors I don’t know about yet
- Situation: Have deployment data but no labels
- Semi-Supervised Learning:
- Scenario: Have 50,000 deployments, can only label 100 manually
- Goal: Get accurate predictions without weeks of labeling
- Trade-off: Slightly lower accuracy than fully supervised, but practical
- Reinforcement Learning:
- The system can safely experiment with different strategies
- Clear success/failure feedback exists
- Goal: Optimize over time through learning
- Reality check: This seems advanced. Would start with simpler approaches first.
Engineer Insight: Start with supervised learning if you have labels, use unsupervised for exploration, and save reinforcement learning for advanced scenarios.
5. Pitfalls I’m Watching Out For
Pitfall 1: Using ML when a simple rule would work
- The trap: Building a supervised learning model to flag deployments with >100 resources
- Better approach: Just write:
if resources > 100: flag = True - Lesson I’m learning: If you can write a rule, write a rule. Don’t overcomplicate.
Warning: Don’t use machine learning when a simple rule will do the job.
Pitfall 2: Expecting unsupervised learning to predict specific outcomes
- The confusion: Thinking clustering will classify incident severity
- The reality: Clustering groups similar things, doesn’t predict labels
- What I understand now: Need supervised learning for classification. Unsupervised discovers patterns.
Pitfall 3: Starting with reinforcement learning
- The temptation: Jumping straight to RL because it sounds advanced
- The problem: Most complex approach, needs experimentation infrastructure
- My plan: Master supervised/unsupervised first. RL comes later.
What I Wish I Knew Earlier
Practitioner’s Lessons:
- Start simple—rules or basic models often win.
- Most effort goes into data labeling, not algorithms.
- Unsupervised learning is for exploring, not predicting.
- Reinforcement learning is rarely the right first step.
- Match your ML approach to your data.
- Clear definitions lead to better designs.
What’s Next?
➡ Series 2 – Chapter 2.1: Data Quality and Preparation
In the next chapter, we’ll explore:
- Data as input, output, and state
- Bad data = bad model (garbage variables = broken infra)
- Data quality checklist: completeness, accuracy, consistency
- Training vs validation vs test sets
- Feature engineering basics
- Data bias and how to detect it
- Practical automation-inspired guidelines
Architectural Question: How does data quality impact both automation and AI systems, and what steps can you take to ensure your data is reliable from the start?
We’ve covered the fundamentals—data, features, labels, training, and inference. Now we’ll see how to orchestrate these pieces into a real ML project.