Chapter 3.3 – Model Evaluation: The Metric That Fooled Me
How misleading metrics can hide real problems, and how to evaluate ML models honestly. Part of the 'From Automation to AI' series.
The Dashboard That Lied
Remember my deployment risk model from Chapter 3.0? I was so proud when I finished training it. The evaluation metrics looked amazing:
1
2
3
4
5
Model Performance Summary
========================
Accuracy: 92.4%
Training Time: 3.2 seconds
Status: ✅ Ready for Production
I showed this to my team. “92% accuracy!” I said. “This thing is going to save us hours of manual review!” We deployed it to production that Friday afternoon.
By Monday morning, I realized something was horribly wrong.
The model had processed 47 deployments over the weekend. It flagged zero as “high risk.” But three of those deployments failed spectacularly—production outages, customer impact, the works. Our supposedly “92% accurate” model missed every single problem.
What went wrong?
The model had learned to predict “low risk” for everything. And since 92% of our deployments historically succeed, it achieved 92% accuracy by… doing absolutely nothing useful.
This is the ML equivalent of an infrastructure monitoring system that achieves “99% uptime” by never actually checking if services are running.
The Automation Parallel: When Metrics Mislead
Before we dive into ML evaluation, let’s talk about something familiar: dashboards.
I once built a CI/CD dashboard that tracked “deployment success rate.” It looked great:
1
2
3
4
5
Q4 Deployment Success Rate
==========================
Overall: 94.7% ✅
Target: 90%
Status: Above Target
Management loved it. I got kudos in the quarterly review.
But here’s what the dashboard didn’t show:
- Dev environment: 99.2% success (1,847 deployments)
- Staging: 88.3% success (234 deployments)
- Production: 62.1% success (58 deployments)
The overall metric was dominated by dev deployments, which were low-risk and high-volume. Production—the only environment that actually mattered—had a terrible success rate, but it was hidden in the average.
Sound familiar?
Machine learning evaluation has the exact same trap. You can have impressive-looking metrics that completely miss the point of what you’re trying to accomplish.
This chapter is about learning to measure what actually matters, not what looks good on a dashboard.
Why Accuracy Is a Trap
The Imbalanced Dataset Problem
Here’s the math behind my 92% accurate failure:
My Historical Deployment Data:
- 1,000 total deployments
- 920 succeeded (92%)
- 80 failed (8%)
My “Brilliant” Model:
1
2
def predict_deployment_risk(deployment):
    return "low risk"  # Always predict success
Results:
- Correct predictions: 920 (the ones that actually succeeded)
- Wrong predictions: 80 (the failures it missed)
- Accuracy: 920/1000 = 92%
This lazy model that does nothing gets 92% accuracy just because most deployments succeed anyway.
The automation equivalent:
Imagine a monitoring alert that never fires:
1
2
def check_service_health(service):
    return "healthy"  # Never alert
If your services are up 95% of the time, this “monitoring system” has 95% accuracy. But it’s completely useless—it never catches the 5% of time when things actually break.
Why This Happens
Machine learning problems are often imbalanced:
- Fraud detection: 99.5% legitimate transactions, 0.5% fraud
- Security threats: 99.9% normal traffic, 0.1% attacks
- Infrastructure failures: 95% successful deploys, 5% failures
When you have imbalanced data, accuracy becomes meaningless. A model can achieve high accuracy by always predicting the common outcome while completely ignoring the rare (but important) cases you actually care about.
The Two Types of Mistakes
After my 92% accurate disaster, I learned to think differently about model errors. There aren’t just “right” and “wrong” predictions—there are two fundamentally different types of wrong.
Type 1: False Alarms
What happened: Model predicted “high risk,” but deployment would have succeeded.
The cost:
- We delay the deployment for extra testing
- Dev team waits 30 minutes
- Context switching, lost focus
- Some frustration (“this thing always cries wolf”)
Think of it like: Your smoke detector going off when you’re cooking dinner. Annoying, but not catastrophic.
Type 2: Missed Problems
What happened: Model predicted “low risk,” deployment went to production, and it failed.
The cost:
- 2 hours of production downtime
- Customer-facing service offline
- Emergency rollback
- Incident review, postmortem
- Damaged trust in the model
Think of it like: Your smoke detector failing to go off during an actual fire. This is the one that matters.
The Critical Insight
You can’t minimize both mistakes simultaneously. There’s always a tradeoff:
- Make the model more sensitive → catch more real problems, but more false alarms
- Make the model more strict → fewer false alarms, but miss more real problems
This is exactly like tuning monitoring alerts:
1
2
3
4
5
6
7
# Option 1: Sensitive (catches everything, lots of noise)
if cpu_usage > 60%:
    alert("High CPU")

# Option 2: Strict (fewer false alarms, might miss issues)
if cpu_usage > 85%:
    alert("High CPU")
Same tradeoff, different domain.
How I Fixed My Evaluation (The Practical Approach)
After the production disaster, I rebuilt my evaluation process. Here’s what I do now:
Step 1: Decide Which Mistake Is More Expensive
Before looking at any metrics, I ask: “What type of error costs more in this specific context?”
For production deployments:
- False alarm cost: 30 minutes of extra testing, some frustration
- Missed problem cost: Hours of downtime, customer impact, incident review
- Decision: I’d rather have false alarms than miss real problems
For dev environment deployments:
- False alarm cost: Same 30 minutes
- Missed problem cost: Dev environment breaks, no customer impact, quick fix
- Decision: Missing some dev problems is okay if it reduces noise
The automation parallel:
Production alerts: Tune for sensitivity (better safe than sorry)
1
2
3
# Production: Aggressive thresholds
if error_rate > 0.1% or response_time > 500ms:
    page_oncall()
Dev alerts: Tune for precision (reduce noise)
1
2
3
# Dev: Relaxed thresholds
if error_rate > 5% or response_time > 2000ms:
    slack_notification()
Same principle applies to ML models.
Step 2: Count Both Types of Mistakes
Instead of just looking at overall accuracy, I track:
| What Happened | Count | What This Means |
|---|---|---|
| Model: “High risk” → Actually failed | 42 | ✅ Caught real problem |
| Model: “High risk” → Actually succeeded | 18 | ⚠️ False alarm |
| Model: “Low risk” → Actually succeeded | 897 | ✅ Correct |
| Model: “Low risk” → Actually failed | 43 | ❌ Missed problem |
From this table, I calculate:
- Catch rate: 42 out of 85 total failures (49%)
- False alarm rate: 18 out of 60 “high risk” flags (30%)
- Miss rate: 43 failures we didn’t catch (51%)
Is this acceptable?
- For production: Probably not (missing half the failures is rough)
- For a first iteration: It’s a start, better than 0%
Step 3: Tune the Confidence Threshold
Here’s something that surprised me: most ML models don’t output “yes/no” predictions. They output a confidence score between 0 and 1:
1
2
3
Deployment-001: 0.92 (92% confident it will fail)
Deployment-002: 0.15 (15% confident it will fail)
Deployment-003: 0.58 (58% confident it will fail)
You choose the cutoff that converts the score into a decision:
- Threshold at 0.5: Anything ≥0.5 is “high risk” (default)
- Threshold at 0.3: Anything ≥0.3 is “high risk” (more sensitive, more alarms)
- Threshold at 0.7: Anything ≥0.7 is “high risk” (stricter, fewer alarms)
How I tune it:
- Start with threshold at 0.5
- Run the model on historical test data
- Count false alarms and missed problems
- Adjust based on which mistake is more expensive:
- Too many misses? Lower to 0.3 (be more sensitive)
- Too many false alarms? Raise to 0.7 (be stricter)
- Repeat until the tradeoff matches my needs
The Terraform parallel:
This is like tuning terraform plan output verbosity:
1
2
3
4
5
6
7
8
# Verbose (catches everything, lots of noise)
terraform plan -detailed-exitcode

# Balanced (shows changes)
terraform plan

# Quiet (only errors)
terraform plan -compact-warnings
You pick the verbosity level that matches your workflow.
A Real Example: Tuning My Deployment Model
Let me walk through what I actually did to fix that 92% accurate disaster.
The Original Model (Threshold: 0.5)
Ran it on 1,000 test deployments:
| Predicted | Actual | Count |
|---|---|---|
| High risk | Failed | 35 |
| High risk | Succeeded | 15 |
| Low risk | Succeeded | 905 |
| Low risk | Failed | 45 |
Results:
- Catch rate: 35/80 failures = 44%
- False alarm rate: 15/50 high-risk flags = 30%
- Accuracy: 940/1000 = 94%
Problem: Missing 56% of failures is unacceptable for production.
Iteration 1: Lower Threshold to 0.3 (More Sensitive)
| Predicted | Actual | Count |
|---|---|---|
| High risk | Failed | 62 |
| High risk | Succeeded | 48 |
| Low risk | Succeeded | 872 |
| Low risk | Failed | 18 |
Results:
- Catch rate: 62/80 = 78% ✅ Much better!
- False alarm rate: 48/110 = 44% ⚠️ Getting noisy
- Accuracy: 934/1000 = 93.4%
Evaluation: This is usable. We catch most problems, false alarms are manageable.
Iteration 2: Try 0.4 (Middle Ground)
| Predicted | Actual | Count |
|---|---|---|
| High risk | Failed | 54 |
| High risk | Succeeded | 28 |
| Low risk | Succeeded | 892 |
| Low risk | Failed | 26 |
Results:
- Catch rate: 54/80 = 68%
- False alarm rate: 28/82 = 34%
- Accuracy: 946/1000 = 94.6%
Decision: I went with threshold 0.3 (Iteration 1). Yes, it has more false alarms, but for production deployments, catching 78% of failures is worth the extra noise. The team can handle reviewing a few extra deployments.
The Key Lesson
Accuracy went down (94% → 93.4%), but the model got way better.
This is the fundamental insight: optimize for what matters, not what looks good on a dashboard.
Comparing Different Models
When you try different models or features, don’t just pick the highest accuracy.
Use a Scorecard
| Model | Catches Failures | False Alarms | Overall Accuracy | Decision |
|---|---|---|---|---|
| Baseline | 10% | 5% | 93% | Misses too much |
| Model A | 55% | 25% | 89% | Good balance |
| Model B | 75% | 45% | 82% | Too many alarms |
| Model C | 60% | 20% | 91% | Best ✅ |
Pick the model that best fits your context, not the highest single number.
Key Takeaways
- ✅ Accuracy is misleading when outcomes are imbalanced (95% safe, 5% risky)
- ✅ Two types of mistakes: false alarms (noise) and missed problems (real cost)
- ✅ Always a tradeoff: more sensitivity = more alarms, more strictness = more misses
- ✅ Context decides: which mistake is more expensive in your situation?
- ✅ Tune the cutoff: adjust the confidence threshold to match your needs
- ✅ This is enough for now: more advanced metrics exist, but learn them when you need rigorous model comparison
Automation Mindset: Model evaluation is like tuning monitoring alerts—find the balance between catching real problems and avoiding alert fatigue. Same tradeoff, different domain.
When to Learn More
This chapter covers the minimum to evaluate models honestly. If you later work on ML professionally or make high-stakes model decisions, explore:
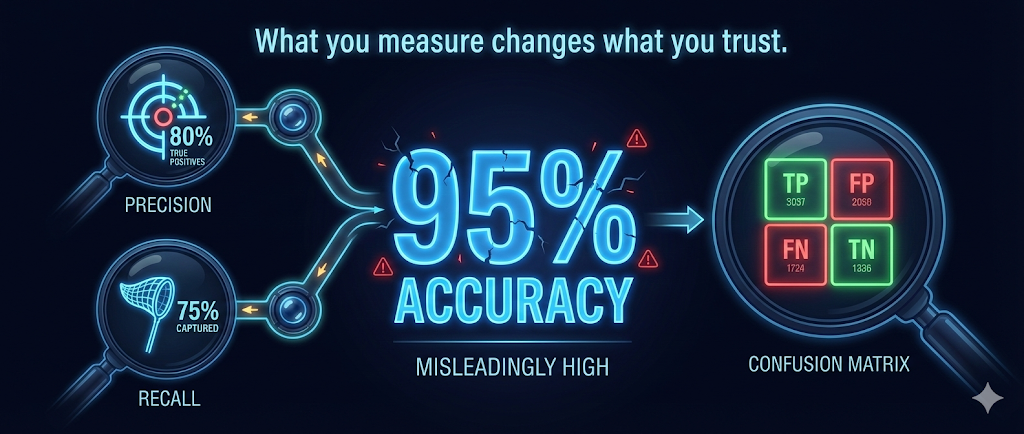
- Precision and Recall: Formal metrics for false alarm rate and catch rate
- F1 Score: Single number that balances both
- ROC Curves: Visual comparison of models across all cutoffs
- Confusion Matrix: Formal table for tracking all outcomes
Resources:
For integrating ML into your systems, the concepts here are enough to avoid common pitfalls.
What I Learned (and What’s Next)
Model evaluation was one of those topics I thought I understood—until I got burned in production. Here’s what really stuck with me:
The big lesson: Don’t trust a single metric. Ever. Just like you wouldn’t judge infrastructure health purely on “uptime percentage,” you can’t judge ML models purely on “accuracy.”
What actually matters:
- Understanding the cost of different mistake types
- Counting both types of errors, not just overall accuracy
- Tuning thresholds to match your specific context
- Being honest about what “good enough” means
The automation connection: Everything I learned about tuning monitoring alerts, balancing false positives and false negatives, thinking about incident costs—all of that directly applies to ML evaluation. It’s the same engineering tradeoffs, just in a different domain.
Where We Are in the Journey
We’ve covered the core ML concepts needed to actually build something:
- ✅ Chapter 3.0: The end-to-end ML workflow
- ✅ Chapter 3.1: How models learn from data
- ✅ Chapter 3.2: Why models fail in production (overfitting/underfitting)
- ✅ Chapter 3.3 (this one): How to evaluate models honestly
Coming next: Chapter 3.4 – Feature Engineering
This is where we get into the real work—taking raw deployment data (commit messages, timestamps, file changes) and transforming it into features your model can actually use. Spoiler: this is where 80% of ML work happens in practice.
If evaluation is like tuning monitoring alerts, feature engineering is like designing your metrics collection strategy. It’s where you decide what to measure in the first place.